But this 10% correction is couched up in terms with Fibonacci numbers, and retracement levels, but I'll just put out a chart that chartpattern.com had this weekend, that sums up what most of Wall Street were expecting. Notice how they looked for lower levels, even the the oversold indicator wa sits lowest since July!

So now all these chart watchers, will wait until the charts confirm the rally, and then they'll miss it.
Goldman, late Friday, came out with a piece saying they thought the S&P 500 would be 1300 by mid year. Goldman trumped Moody's puff piece!
Look at the economic forecasts of just two weeks ago. We all know how the GDP report was supposedly a function of increasing inventories. Check out what CIBC had to say here on their report on Canada and the US. Just-in-time ordering etc, would keep the contribution from the rebuilding of inventoroes to just a small fraction!
But look at the entry points this market has given you. Friday morning, I mentioned these stocks:
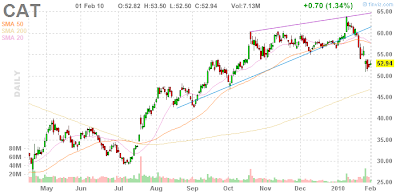
But X (45.58) DE (51.11) CAT (51.86), FCX (68.82), CMI (45.55) have all corrected enough to give good entry points again.
Check out the charts. Why would anyone bother waiting for a bigger pullback, when these numbers had already come down so much already? They came down so hard, and were so oversold you can hardly notice today's green bar!


But that's what you have to buy in this market. You need to buy the downside headfakes.
Today, we'll have Volcker on the hill.

More theater, that doesn't mean anything.
Chris Dodd needs a job in the private sector.

And he's gunning for it now!
Because he knows Obama really isn't a believer in Paul!
No comments:
Post a Comment